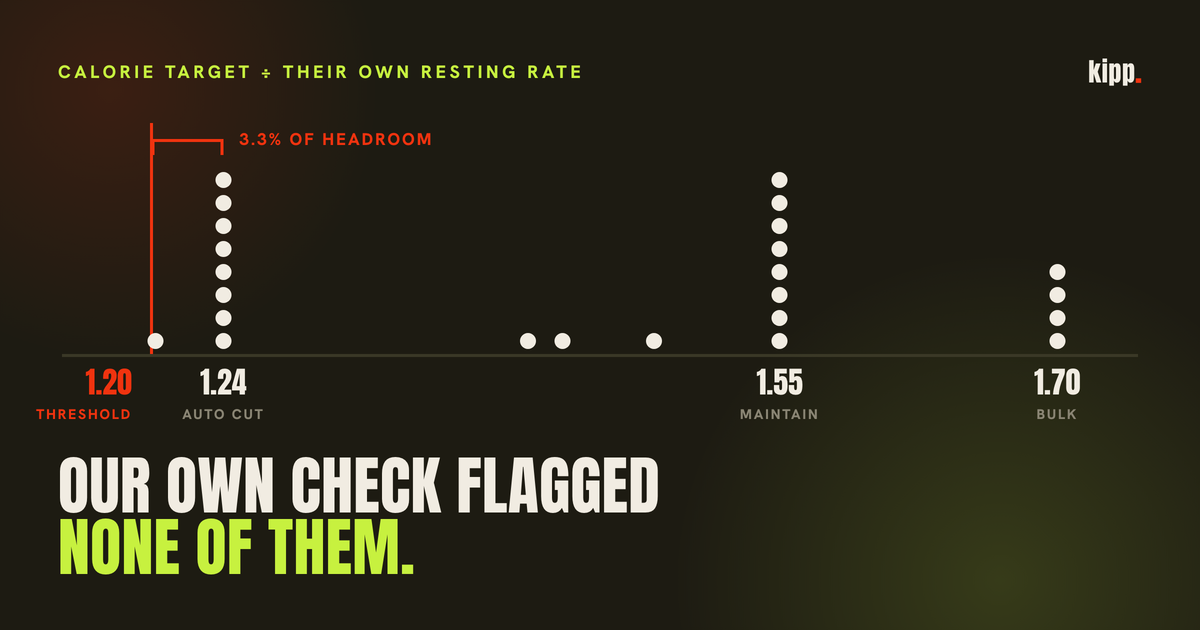
Our app has a check for exactly this question. Today it fires for none of the 24 athletes we can run it on.
That reads like good news. Then you look at where those 24 actually sit. Eight of them are packed into a band four thousandths wide, at 1.24 times their own estimated resting metabolic rate. Not because eight people independently converged on a sensible number, but because one formula produced all eight, and the threshold it gets checked against sits 3.3% below where that formula lands. The check and the targets it is checking come from the same arithmetic.
The short answer
A calorie target below your resting metabolic rate is worth questioning, because it asks you to run a deficit before you have stood up. Divide your target by your Mifflin-St Jeor BMR: under 1.2 and it is below what a sedentary day costs, before training. But treat that ratio as a prompt, not a verdict. The resting-rate figure is an estimate that runs low in athletes, which makes the ratio look safer than it is, and it is not the clinical measure of under-fuelling anyway. The number that matters more is how long it has been since anything recalculated your target, and whether your sleep, energy, training and cycle have been telling you something the arithmetic cannot see.
Below: what the two numbers are, why the industry's flat floor cannot work, what a ratio test gets right, and the three ways ours is weaker than it looks.
Two numbers, and the gap between them is where you live
Basal metabolic rate is what your body spends staying alive at rest. Breathing, circulation, kidney function, keeping a brain lit. It is the largest single component of most people's daily expenditure and you have very little say in it.
Total daily energy expenditure is that figure multiplied by an activity factor covering everything else you do. The standard commercial ladder runs 1.2 for sedentary, up through 1.55 for moderately active, to around 1.9. We use 1.55, and we have written before about how shaky that multiplier is: it is a population range being used as a personal number.
A calorie target is then that TDEE adjusted for a goal. Ours computes a cut as bmr * 1.55 * 0.8.
Do the arithmetic on that expression and you get 1.24 times BMR. Every athlete on an automatically calculated cut arrives at exactly that ratio, regardless of their size, sex or age, because the size, sex and age all sit inside the BMR that then gets divided back out. This turns out to matter.
The industry's answer is a flat floor, and a flat floor cannot work
The convention most calorie apps use is a hard minimum. MyFitnessPal will not set a goal below 1,200 kcal for women or 1,500 for men, and holds that line even when your stated rate of loss would mathematically require less.
Those numbers are usually attributed to NIH guidance, and they do have a real source: the NHLBI Practical Guide to the Identification, Evaluation, and Treatment of Overweight and Obesity in Adults, which recommends low-calorie diets of "1,000 to 1,200 kcal/day ... for most women" and "1,200 kcal/day and 1,600 kcal/day ... for men".
Read the sentence to the end, though, because the apps do not. The guide says the higher, men's band "may be appropriate for women who weigh 165 pounds or more, or who exercise regularly". The distinction the source draws is the exact distinction a flat floor has no way to express, and it is the one that matters for everyone reading this. It is also worth noticing what document this is: a clinical protocol for treating obesity, being used as the safety rail for people training for a race.
As consumer safety engineering a floor is defensible. As a personal number it has a structural problem: a single value cannot track a quantity that varies with body size.
We measured how badly. Across our 24 athletes with complete height, weight and age, estimated BMR ranges from 1,148 to 1,961 kcal, a spread of 813 kcal and a factor of 1.71. Against that spread, the flat floor takes exactly two values.
| Estimated BMR | Flat floor for their sex | Floor as % of their BMR | |
|---|---|---|---|
| Smallest athlete on the roster | 1,148 | 1,200 | 105% |
| A 62 kg woman, 148 cm | 1,248 | 1,200 | 96% |
| A 79 kg woman | 1,594 | 1,200 | 75% |
| A 91 kg man | 1,961 | 1,500 | 76% |
For 22 of the 24, the industry floor for their sex sits below their own resting metabolic rate. The rail meant to stop a target going somewhere dangerous would, for almost all of them, permit a target under what their body spends unconscious. And none of the 24 would clear a sedentary-day test at that floor.
The floor is not useless. It catches the case it was designed for, a small person told to eat 900 kcal. It just stops being a meaningful guard the moment the person it is applied to is larger than the person it was calibrated on.
So we used a ratio instead
The obvious fix is to guard the target against the athlete's own resting rate rather than against a constant. Our check divides the calorie target by the individual's Mifflin-St Jeor BMR and objects below 1.2, the standard sedentary activity factor. Below that line the target is under what a desk-bound day costs, before any training is counted.
That is genuinely better. It scales, it uses the athlete's own numbers, and it has no population assumption baked into it beyond the equation itself.
Here is what it returns on the real roster, measured on 30 August 2026. Every athlete with a stored calorie target and complete body numbers, sorted by ratio:
| Target ÷ BMR | Athletes | Who set the target |
|---|---|---|
| 1.202 | 1 | Set by a coach |
| 1.238 to 1.242 | 8 | All automatic, all cutting |
| 1.411, 1.429, 1.479 | 3 | All set by a coach |
| 1.550 to 1.559 | 8 | 7 automatic, 1 coach |
| 1.703 to 1.707 | 4 | 3 automatic, 1 coach |
Twenty of the 24 sit inside three tight clusters, and the clusters are not a finding about human metabolism. They are the three settings of our own formula: 1.55 × 0.8 = 1.24 for a cut, 1.55 for maintenance, 1.55 × 1.1 = 1.705 for a bulk. Every one of the four targets that lands outside all three clusters was set by a human being overriding the formula.
Zero flagged. And the reason zero flagged is that the automatic cut setting arrives 3.3% above the threshold, by construction, every time.
The margin is thin enough to say out loud: drop the deficit multiplier from 0.8 to 0.77, or the activity factor from 1.55 to 1.50, and this check starts firing for eight athletes simultaneously, none of whose circumstances have changed. If that ever happens, the honest reading is that the targets moved, not that the check broke.
The nearest miss is not in the cluster at all. One athlete, on a target a coach set by hand rather than one the formula produced, sits at 1.202. Her estimated BMR is 1,248 kcal, so the threshold for her is 1,497.6. Her target is 1,500.
She clears the check by 2.4 kcal a day.
Three reasons the check is weaker than it looks
The denominator is an estimate, and in athletes it runs low
The ratio is only as good as the BMR underneath it, and that BMR is not measured. It is Mifflin-St Jeor, a regression on height, weight, age and sex.
In a general population that equation holds up reasonably well, which is what our earlier piece on TDEE found. In an athletic one it does not hold up the same way. Fields and colleagues put ten common prediction equations against indirect calorimetry in 187 NCAA Division III athletes, 97 men and 90 women, and found that all ten significantly underestimated measured resting metabolic rate (p < 0.001), the only exceptions being the De Lorenzo and Watson equations in the women. The mechanism is not mysterious: these equations key off total body mass, and a given kilogram of an athlete is more likely to be metabolically active tissue than the same kilogram of the population the equation was fitted on.
Now follow that through our arithmetic. The ratio is target divided by BMR. If the BMR is underestimated, the ratio is overestimated. A check that objects when the ratio is too low therefore objects less often than it should, in precisely the population it was built for.
That last step is an inference from the equation's documented bias rather than something we have tested against measured RMR on our own athletes, so treat it as a reasonable read rather than a finding. We have no indirect calorimetry on this roster and no way to get it.
But the direction is the uncomfortable part, and it is the same asymmetry we ran into building the TDEE check: the error does not scatter randomly, it points toward reassurance.
The ratio rises as you lose weight
This one is worth sitting with, because it inverts what you would assume.
BMR is largely a function of body mass. Lose weight and your resting rate falls. If your calorie target does not fall with it, the ratio between them increases. A target that was 1.20 times your resting rate becomes 1.23, then 1.26, while the absolute number of calories has not moved at all.
Measured on our own cutting athletes, holding the target fixed and dropping 5 kg:
| Athlete | Ratio now | After losing 5 kg |
|---|---|---|
| 79 kg woman | 1.242 | 1.282 |
| 63.7 kg woman | 1.238 | 1.283 |
| 94.3 kg man | 1.239 | 1.272 |
| 72.1 kg man | 1.240 | 1.282 |
Every one moves further from the line. So a safety check built on this ratio becomes more permissive the longer an unchanged target is left in place, and most permissive exactly when the weight loss has gone furthest. A number that was borderline at the start of a cut looks comfortable three months in, on the strength of the athlete having got smaller.
This is why the check has no tolerance band on the 1.2 threshold. An earlier version had a 5% one, which would have put a real athlete at 1.13 just inside a 1.14 line, and losing 2 kg would have lifted her over it and silently switched the warning off with nothing about her situation having changed. The noise in this test lives in the BMR estimate, not in the threshold, so padding the threshold buys nothing and costs exactly the cases it should catch.
The real conclusion is not about thresholds at all. It is that a calorie target is a perishable number, and one that has not been recalculated since you were 5 kg heavier is not the number you agreed to any more.
It is not the clinical measure, and the clinical measure is contested too
Everything above is a proxy. The actual sports-science construct for under-fuelling is energy availability: your energy intake, minus the energy your exercise costs, divided by your fat-free mass, expressed in kcal per kg of fat-free mass per day.
Note what is in there that our ratio does not have. It subtracts training, so a hard week lowers it while the calorie target sits still. It divides by lean mass rather than total mass. Below 30 kcal per kg of fat-free mass per day has been the widely cited threshold for low energy availability in women, the state underpinning Relative Energy Deficiency in Sport.
We do not compute this, and we say so plainly: we do not reliably know most athletes' fat-free mass, and exercise energy expenditure from a wearable is an estimate stacked on an estimate.
That is not only our limitation. The 30 kcal/kg threshold itself is contested, derived from laboratory work in non-athletic women in the early 2000s, with the equivalent range in men appearing lower and less well characterised. The 2023 IOC consensus statement on REDs moved deliberately away from treating a single cut-off as diagnostic, toward a spectrum and toward symptoms, on the grounds that energy availability cannot be measured accurately enough in free-living conditions to hang a diagnosis on.
Which leaves the whole field, and us, in the same place: the arithmetic opens the question and cannot close it.
What to actually do with this
Run the ratio. It costs a minute. Estimate your BMR with Mifflin-St Jeor, divide your target by it, and see where you land. Under 1.2 is a real prompt to ask questions.
Then hold the answer loosely in both directions, and put more weight on these:
How long has your target been sitting there? This is the question with the best answer-to-effort ratio in the whole piece. A target set at onboarding, against a bodyweight you no longer have, is stale in a way no ratio will report.
Who set it, and against what? A number a formula produced is a hypothesis about you. A number you or a coach chose is a decision, and decisions can be revisited. On our roster the four targets sitting outside the formula's three clusters were all human-set, including both the lowest one and one of the highest.
What have your body and your training been saying? Persistent fatigue that sleep does not fix, stalled or reversing training progress, poor recovery, unusual susceptibility to illness, bone stress niggles, a late or absent period. These are what the IOC consensus moved toward and what the arithmetic cannot see. If several are present, that outranks a ratio of 1.24, and it is a conversation for a doctor or a sports dietitian rather than a calculator.
And the rule that governs all of it: a check that did not fire is not a clearance. Ours fired for nobody on the day we measured it. Given how the targets and the threshold are built, and which way the estimation error points, that is close to what it was always going to say.
Kipp computes your calorie target the way everyone does, and then keeps checking it against your own resting rate, your food log and your weigh-ins as they change. When the target looks too low for what you are actually doing, it raises it with you and explains why, rather than quietly handing you what is left of it as though the number were sound.
Sources
- The flat minimum calorie goals of 1,200 kcal for women and 1,500 for men, and the app holding that line regardless of the stated rate of loss. MyFitnessPal community documentation of the floor.
- The underlying clinical guidance, including the "1,000 to 1,200 kcal/day ... for most women" and "1,200 kcal/day and 1,600 kcal/day ... for men" bands and the carve-out for women "who weigh 165 pounds or more, or who exercise regularly". National Heart, Lung, and Blood Institute, The Practical Guide: Identification, Evaluation, and Treatment of Overweight and Obesity in Adults, NIH Publication 00-4084, 2000, section on low-calorie diets. NHLBI PDF
- Mifflin MD, St Jeor ST, et al. A new predictive equation for resting energy expenditure in healthy individuals. American Journal of Clinical Nutrition 1990. doi:10.1093/ajcn/51.2.241
- All ten common prediction equations significantly underestimating measured RMR in collegiate athletes (p < 0.001), with De Lorenzo and Watson the exceptions in women. Fields JB, et al. The accuracy of ten common resting metabolic rate prediction equations in men and women collegiate athletes. European Journal of Sport Science 2023, n = 187 (97 men, 90 women). doi:10.1080/17461391.2022.2130098
- Prediction equations performing inconsistently in athletes more broadly. O'Neill JER, et al. Accuracy of Resting Metabolic Rate Prediction Equations in Athletes: A Systematic Review with Meta-analysis. Sports Medicine 2023. doi:10.1007/s40279-023-01896-z
- Energy availability defined as (energy intake - exercise energy expenditure) / fat-free mass, and the 30 kcal/kg FFM/day threshold. Mountjoy M, et al. IOC consensus statement on relative energy deficiency in sport (RED-S): 2018 update. British Journal of Sports Medicine 2018;52:687-697. doi:10.1136/bjsports-2018-099193
- The move away from a single diagnostic cut-off toward a spectrum and symptom-based assessment, and the position that energy availability cannot be measured accurately in free-living conditions. Mountjoy M, Ackerman KE, et al. 2023 International Olympic Committee's consensus statement on Relative Energy Deficiency in Sport (REDs). British Journal of Sports Medicine 2023;57:1073-1097. doi:10.1136/bjsports-2023-106994
- The FAO/WHO/UNU activity-level reference underlying the discussion of the 1.55 multiplier is covered in our earlier piece, How accurate is your TDEE?
- The 24-athlete ratio distribution, the BMR range of 1,148 to 1,961 kcal, the 22-of-24 flat-floor comparison, the 2.4 kcal near-miss and the weight-loss sensitivity table are from our own roster, measured on 30 August 2026 by running our production check over real profile data. One roster, 24 athletes with complete body numbers out of 35 profiles. Small sample, and we are not claiming any of it generalises beyond showing what this class of check does and does not catch.