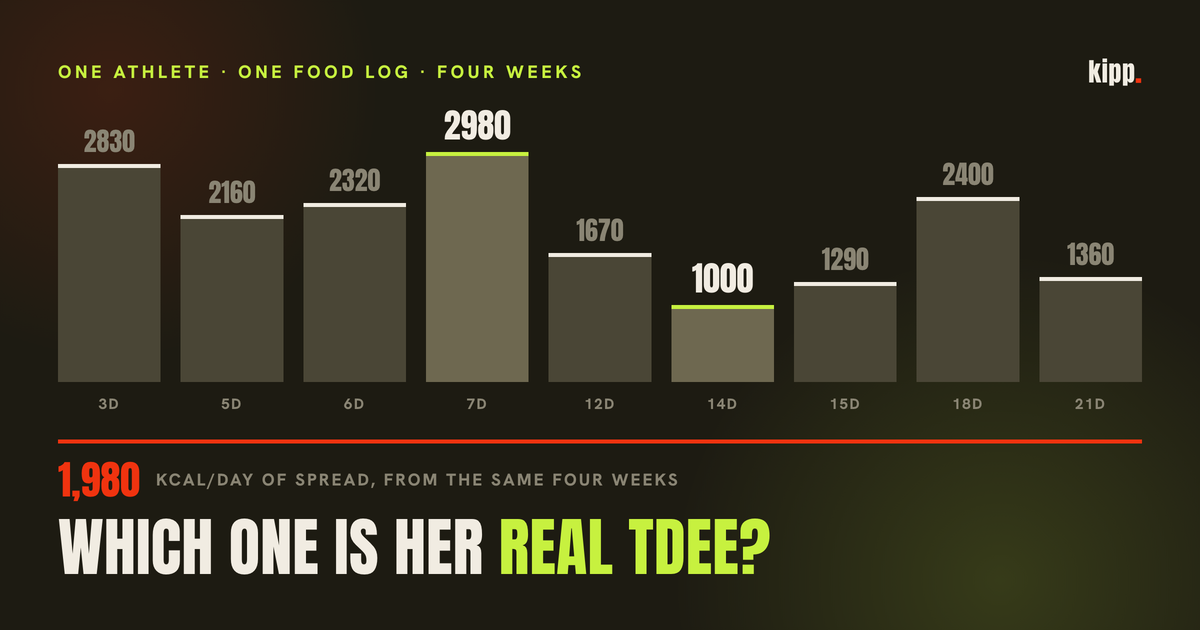
Over four weeks this summer, one athlete on our roster logged her food on 21 of 22 days and weighed herself on 10 separate days, from 17 readings. That is dense data by any standard, and far denser than almost anyone manages.
From it you can work out what she actually burns. The arithmetic is one line. Depending only on which of those days you treat as her final weigh-in, that one line returns 1,000 kcal a day. Or 2,980. Or seven other numbers in between. Same person, same four weeks, same food log. The only thing that changed is when she last stepped on the scale.
The short answer
A TDEE calculator is a resting-rate equation multiplied by an activity factor. The equation is decent; the multiplier is a population range being used as your personal number. The only thing that can check it is your own weight trend against your own food log, over at least three weeks, with enough weigh-ins to average five at each end. And you can only act on the answer in one direction: if it says you burn more than the calculator thinks, believe it. If it says you burn less, that is also what an incomplete food diary looks like, and cutting your target on it is the worst move available.
Below is where the calculator's number comes from, the arithmetic that checks it, what that check did on our own roster, and why we built it and then made it almost impossible to trigger.
The calculator is two numbers, and only one of them is any good
Every TDEE calculator does the same two steps. Estimate resting metabolic rate from your height, weight, age and sex, then multiply by an activity factor.
The first step is fine. Mifflin-St Jeor is the standard equation and it holds up. A systematic review of predictive equations found it landed within 10% of measured resting metabolic rate in more people, obese and non-obese, than any competing equation, with the narrowest error range. A later study putting a figure on that accuracy rate found it correct within 10% about 82% of the time, and unbiased on average, with a 95% confidence interval on its mean error of -26 to +8 kcal a day. Accuracy falls in people with obesity, 75% against 87%, but for a training population it is a reasonable instrument.
The second step is where the number stops being about you.
The activity factor does have a real scientific lineage, and it is worth knowing what that lineage actually says. The FAO/WHO/UNU 2001 expert consultation on human energy requirements defines physical activity level, PAL, as total energy expenditure divided by basal metabolic rate, measured by doubly labelled water. Its table for adults gives three lifestyle categories, and deliberately gives each one a range rather than a mean:
| Lifestyle category | PAL range |
|---|---|
| Sedentary or light activity | 1.40 to 1.69 |
| Active or moderately active | 1.70 to 1.99 |
| Vigorous or vigorously active | 2.00 to 2.40 |
The report states that values sustainable long term by free-living adults "range from about 1.40 to 2.40", and that above 2.40 is hard to maintain.
Read the top and bottom of that range against a single body. For someone with a resting rate of 1,600 kcal, a PAL of 1.40 is 2,240 kcal a day and a PAL of 2.40 is 3,840. The honest span of the multiplier is worth more than 1,500 kcal a day, and a calculator resolves it by asking you to pick from five dropdown options describing how often you exercise.
That is the part nobody tells you. The equation hands you a number with a real error bar attached. The multiplier hands you a number drawn from a range wider than most people's entire daily intake, and presents it as though it were measured.
Our own multiplier, and what it is actually called
We should say what ours is, because we have the same problem.
Every calorie target this app produces starts as mifflinStJeorBmr(...) * 1.55. The constant is named ACTIVE_TDEE_FACTOR and its comment describes it as the "TDEE multiplier for a moderately-active athlete".
Against the FAO table above, 1.55 sits in the sedentary or light activity band. The moderately active band starts at 1.70.
Two conventions are in circulation and they disagree. The commercial fitness ladder, the 1.2 / 1.375 / 1.55 / 1.725 / 1.9 one that appears in personal training syllabuses and on most calculators, calls 1.55 "moderately active, exercise 3 to 4 times a week". The international reference derived from doubly labelled water puts that same figure one band lower. We inherited the commercial ladder, as nearly everyone has, and named our constant after the band the other convention would put it in.
This does not establish that our number is too low. It establishes that the label on it is not a measured fact, which is the whole reason the rest of this article exists. Whether 1.55 is right for a given athlete is an empirical question, and there is exactly one way to answer it.
The arithmetic that checks it
Energy that goes in and does not get burned is stored. Over a period, therefore:
measured TDEE = average daily intake - (weight change in kg x 7700 / days)
Lose half a kilo over three weeks while eating 2,000 a day and you were burning about 2,180. That is the whole method. It is what MacroFactor, CalTrack and every adaptive-TDEE spreadsheet are doing underneath, and it is the only way to get a personal number without a metabolic ward.
Two caveats, because this constant has a bad reputation and partly deserves it.
The 7,700 kcal per kilo rule is genuinely criticised, but for a different use than this one. The critique, most associated with Kevin Hall's dynamic modelling work, is about predicting future weight loss: assuming expenditure stays constant while you diet overestimates loss by roughly 63% at one year, 346% at five years and 764% at ten. That is fatal for the "cut 500 a day and lose a pound a week, forever" claim. It bears much less on the use here, which runs the equation backwards over three or four weeks to infer average expenditure from a change that has already happened. Over that horizon the adaptive drift the critique is about has barely started. That is a reasoned distinction rather than a tested one: we know of no study validating the backwards use specifically, so treat it as a defensible reading of the objection rather than a finding.
The composition problem does not go away, and it drives everything below. The 7,700 figure assumes the mass you gained or lost was ordinary body tissue. Reviews put the fat-free share of weight lost anywhere between 20 and 40%. And water carries no energy at all. So half a kilo of water swing, scored at 7,700 kcal per kilo, invents 3,850 kcal that never existed. Spread across an 18-day window, that is about 214 kcal a day of pure fiction from one ordinary fluctuation.
That is not a rounding error. It is larger than most people's dinner.
What that noise does to a real answer
Here is our athlete's actual weigh-in series across the four weeks, one reading per day, in kilograms:
61.4 · 60.9 · 61.0 · 60.8 · 60.1 · 61.2 · 62.4 · 61.9 · 59.4 · 61.9
Look at the last three. She recorded 61.9 kg, then 59.4 kg three days later, then 61.9 kg again three days after that. A 2.5 kg round trip inside a week. Nothing about her body changed by 2.5 kg in three days. That is fluid, food mass and glycogen, and it is completely normal.
Now run the naive version of the check on her. Take her first weigh-in, take one later weigh-in, difference them, and combine with her real logged intake of 1,546 kcal a day.
| Last weigh-in used | Span | Weight change | Implied maintenance |
|---|---|---|---|
| 10 Aug | 3 days | -0.5 kg | 2,830 |
| 12 Aug | 5 days | -0.4 kg | 2,160 |
| 13 Aug | 6 days | -0.6 kg | 2,320 |
| 14 Aug | 7 days | -1.3 kg | 2,980 |
| 19 Aug | 12 days | -0.2 kg | 1,670 |
| 21 Aug | 14 days | +1.0 kg | 1,000 |
| 22 Aug | 15 days | +0.5 kg | 1,290 |
| 25 Aug | 18 days | -2.0 kg | 2,400 |
| 28 Aug | 21 days | +0.5 kg | 1,360 |
One person. One food log. Answers from 1,000 to 2,980 kcal a day. Had she checked her TDEE on 14 August she would have concluded she burns nearly 3,000 a day and eaten accordingly. A week later the same method would have told her 1,000.
This is why "just track your weight and calories for a few weeks" is good advice given badly. The method works. The naive implementation of it is a random number generator with a plausible face, and the shorter the window the worse it gets.
Two fixes do most of the work and neither costs anything.
Average the endpoints instead of differencing them. Take the mean of every reading in the first five days and the mean of every reading in the last five, then measure the span centre to centre. On this athlete that turns the endpoints into 61.15 kg and 60.65 kg, a change of -0.50 kg over 18 days, and gives about 1,750 kcal a day. Notice what it does to that wild 59.4: averaged with the 61.9 three days later it lands at 60.65 instead of deciding the answer on its own.
Insist on a long enough span. Every one of the top four rows in that table, the ones returning 2,160 to 2,980, comes from a window under eight days. At that length you are measuring hydration.
The error has a direction, and it is the dangerous one
This is the part that changed how we built it, and the single most important thing on this page.
The estimate is built on self-reported intake, and self-reported intake is not wrong at random. It is wrong downward, systematically, in most people.
The evidence is large and old. Measured against total energy expenditure by doubly labelled water, which has a relative accuracy of about 1%, dietary records and 24-hour recalls underestimate intake by roughly 10 to 20%, and food frequency questionnaires by 20 to 30%. More than a third of individuals underreport by more than 25%. The largest recent analysis, Bajunaid et al. in Nature Food (2025), derived a predictive equation from 6,497 doubly labelled water measurements in people aged 4 to 96 and applied it to national dietary surveys: 27.4% of dietary reports carried implausible energy intakes. Among NHANES adults, roughly 32.8% of men and 28.4% of women fell below the plausible interval.
None of that requires anyone to be dishonest. It is the drink nobody thinks of as food, the weekend the app stayed shut, the oil in the pan.
Now put it into the equation. Under-logging by 300 kcal a day understates your average intake by 300, and therefore understates the derived maintenance figure by exactly 300. The bias runs one way only.
Which makes the two possible results deeply unequal:
- Measured comes out HIGHER than the calculator. This survives the bias. Under-logging would have hidden a finding like this rather than created it, so when it appears anyway it appeared despite the thing most likely to distort it. The action it implies, eat more, is also the safe one to be wrong about.
- Measured comes out LOWER than the calculator. This is exactly, indistinguishably, what an incomplete food log produces. It is not evidence of a slow metabolism. And its apparent action, eat less, is the harmful one.
That asymmetry is the entire design. A tool that quietly manufactures evidence for under-eating is worse than no tool, and a low reading is the easiest evidence in the world to manufacture: it takes a normal person forgetting a normal amount of food.
So our coach may raise a target on this signal, with the athlete, saying plainly where the number came from. It is forbidden from lowering one on it, forbidden from describing anyone's metabolism as slow or damaged, and instructed to ask an open question about whether the last few weeks of logging felt complete. If the athlete says their logging has been patchy, that is the answer.
What happened when we ran it on the whole roster
We wrote the check, put gates in front of it, and ran it across every athlete's real food log and real weigh-in series.
It produced a line for zero of them.
Here is the breakdown across 33 athletes with a profile, measured on 28 August 2026:
| Why the check stayed silent | Athletes |
|---|---|
| No stored height, age or bodyweight | 11 |
| No weigh-ins at all in the window | 18 |
| Between one and five weigh-in days | 3 |
| Enough weigh-ins to proceed | 1 |
Only 2 of the 33 had logged food on 15 or more days.
The shape of that table is the finding. Weigh-in frequency is the binding constraint, and it is not close. Everyone assumes the hard part is logging food, because logging food is the part that feels like work. It is not. Thirty-two of thirty-three athletes were stopped before their food log mattered at all, most of them by a bathroom scale they own and do not stand on. We reached the same conclusion by a different route when we looked at what time of day people weigh themselves.
What the gates protect against is not hypothetical. One athlete logged food on 20 days, densely and carefully, against four weigh-in days on a stale, jumpy series. Let that through and the arithmetic returns a maintenance figure of about 350 kcal a day for an 84 kg man. That number is not a bug. It is what real data does to an ungated formula, and it is now pinned as a regression test so nobody can ship it by accident.
The one athlete we could nearly check
Our densest logger, the one from the opening, cleared the weigh-in gate, the food-logging gate and the coverage gate. She logged 21 of 22 days, 95% coverage.
She was refused on span. Her two averaged endpoints sit 18 days apart against a 21-day minimum. That is the gate working rather than failing: on this data the difference between an 18-day and a 21-day window is the difference between the 2,400 row and the 1,360 row of the table above.
Carrying the arithmetic past our own gate by hand, which the app never does, gives this:
| Figure | Value |
|---|---|
| What the formula assumes she burns | 1,934 kcal/day |
| What her food and scale imply | ~1,750 kcal/day |
| Gap | -184 kcal/day |
| Weight change the formula predicted | -0.9 kg |
| Weight change the scale recorded | -0.5 kg |
A 184 kcal a day gap is about 9.5% of the modelled figure, and inside the roughly ±250 kcal noise band the method carries after endpoint averaging. On the one athlete in 33 whose data comes close to supporting the question, the flat 1.55 multiplier is right to within about ten percent.
Then the honest part, which is that this settles less than it looks like it settles. The gap points downward, and downward is the direction the previous section explained we cannot act on: a mild amount of under-logging produces exactly this result whether or not the multiplier is correct. Her data is consistent with 1.55 being right for her. It is equally consistent with 1.55 being slightly low and her diary being slightly incomplete. From here those two cannot be told apart, which is why the honest output is a silence rather than a conclusion.
Note too that this cuts against the FAO observation earlier. The category table hints that 1.55 might be low for a training population. Her measured data gives no support whatever for raising it. Two facts pointing opposite ways, on a sample of one. We are reporting both rather than the convenient one.
The part we got wrong
We keep a read-only audit script that replays this check over every athlete and prints the reason each one was refused. Its own header claims that because it drives the real function, "an audit can never diverge from what the coach actually sees".
While writing this article, it diverged. The script reported our densest athlete as refused on "coverage / materiality". The real reason was the span, three gates earlier.
The cause is dull and worth knowing anyway. The audit fetches a slightly wider lookback than the check uses, 35 days against 28, and recomputes its explanatory columns over that wider set. Its span column therefore read 32 days while the function was working with 18, so it fell through to the wrong branch of its own explanation. The verdict was right throughout, because that comes from the real function. Only the stated reason was wrong.
An audit that gets the answer right and the reason wrong is a particular kind of trap, because the reason is what you use to decide which constant to tune. We would have gone to look at the coverage threshold, sensibly enough, while the span gate was doing the work.
How to do this yourself
You do not need an app for any of this. You need a scale, a food log and four weeks.
- Weigh most days, at the same time, ideally first thing after the toilet and before eating. Consistency matters more than the accuracy of the scale. If you weigh twice a week you cannot do this at all, and that is the constraint that actually stops people.
- Log food for at least three weeks and cover at least 70% of the days. A missing day is not neutral. People stop logging on the days they eat out, so the days you skip are systematically the big ones.
- Average, do not difference. Mean of your first five days of readings, mean of your last five, and measure the span between the midpoints of those two blocks.
- Do the line. Average daily intake, minus (kilos changed x 7,700 / days).
- Treat ±250 kcal a day as agreement. Anything inside that is noise, and acting as though it were a finding means chasing water weight.
- Only act on it in one direction. Higher than the calculator: believable, and you can raise your intake toward it. Lower: check your logging first, and do not cut. If you take one thing from this article, take that.
- Re-run every four to six weeks, not weekly. A weekly recompute chases noise, and real expenditure moves slowly.
The number a calculator gives you is not useless. It is a reasonable starting hypothesis drawn from a population and it will be roughly right for a lot of people. What it is not is a measurement of you, and the only instrument that can turn it into one is the scale you already own, used more often than you currently use it.
Kipp builds your calorie target the way everyone does, then checks it against your own food log and weigh-ins and tells you when the two disagree. It will raise a target with you when the evidence points that way, and it is not permitted to lower one on an estimate that an incomplete food diary could have produced.
Sources
- Mifflin-St Jeor predicting resting metabolic rate within 10% of measured in more people than any competing equation, with the narrowest error range. Frankenfield D, et al. Comparison of predictive equations for resting metabolic rate in healthy nonobese and obese adults: a systematic review. Journal of the American Dietetic Association 2005. doi:10.1016/j.jada.2005.02.005
- The 82% accuracy rate, the 87% against 75% split by obesity status, and the mean bias 95% CI of -26 to +8 kcal/day. Bias and accuracy of resting metabolic rate equations in non-obese and obese adults, Clinical Nutrition 2013.
- PAL defined as TEE/BMR, the three adult lifestyle categories (1.40-1.69 sedentary or light, 1.70-1.99 active or moderately active, 2.00-2.40 vigorous) and the statement that sustainable values "range from about 1.40 to 2.40". Joint FAO/WHO/UNU Expert Consultation, Human Energy Requirements, 2001, chapter 5. FAO
- The static 3,500 kcal per pound rule overestimating weight loss by 63% at one year, 346% at five and 764% at ten, and the constant-expenditure assumption behind it. Thomas DM, et al. Why is the 3500 kcal per pound weight loss rule wrong? International Journal of Obesity 2013. doi:10.1038/ijo.2013.112, with the published response. The 20-40% fat-free share of weight lost comes from the same literature.
- Under-reporting of self-reported energy intake against doubly labelled water: 10-20% for records and 24-hour recalls, 20-30% for food frequency questionnaires, and over a third of individuals underreporting by more than 25%. Validation of habitual energy intake, Public Health Nutrition.
- Bajunaid R, et al. Predictive equation derived from 6,497 doubly labelled water measurements enables the detection of erroneous self-reported energy intake. Nature Food 2025. 27.4% of dietary reports carrying implausible energy intakes; approximately 32.8% of male and 28.4% of female NHANES adults below the plausible interval. doi:10.1038/s43016-024-01089-5
- The 33-athlete gate breakdown, the weigh-in series, the 1,000 to 2,980 endpoint table, the 1,934 against 1,750 comparison and the 350 kcal/day regression case are from our own roster, measured on 28 August 2026 by replaying our production check over real data. One roster, and the numbers that matter here come from a single athlete. We are not claiming any of it generalises.