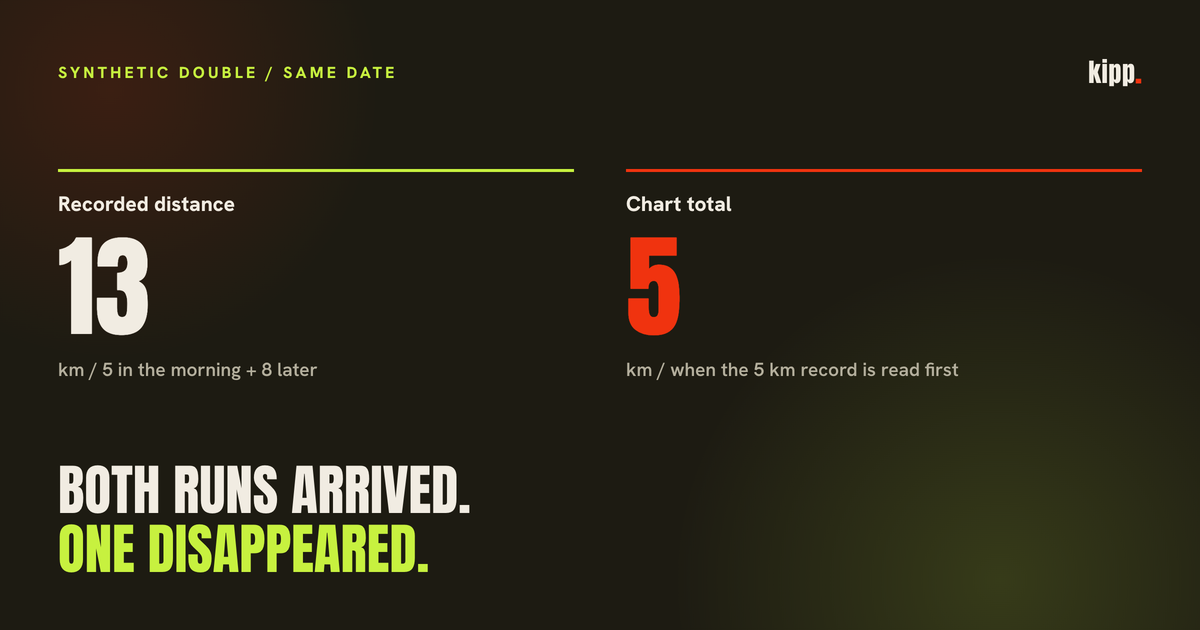
Five kilometres in the morning and eight in the evening add up to 13. Feed those two runs to our endurance chart on the same date and the total can be five. Reverse their input order and it becomes eight.
Both records reached the calculation. Neither result is a sync failure. These are synthetic runs executed against our current chart behavior, and they expose a daily grouping rule that removes a genuine second session along with the duplicates it was meant to guard against.
The short answer
Check the activity list before reconnecting your watch. A chart can receive both runs and still keep only one record per sport per day. Our endurance chart does exactly that: it selects the record with more populated fields, retaining the first on a tie. Two same-day runs can therefore become one chart entry with an understated distance total. This limitation remains in the current chart behavior.
One point per day can mean two different things
A chart could show one daily point by adding that day's runs together. Five plus eight would still produce 13 km, with the point representing a daily total. Or it could select one run and discard the other from the series. Those operations can look identical until you inspect the number.
Our endurance chart uses the second operation. For each sport and date, it chooses the record with more populated fields. It does not add together two sessions of the same sport on that date.
The distinction from source deduplication matters. The input is already a list of unified events, and the function's own header describes it as already merged. This daily collapse is an additional step. It can therefore undercount even when the earlier matching stage has correctly left two separate workouts intact.
The four checks we ran
Our examples use a 5 km run lasting 30 minutes and an 8 km run lasting 48 minutes. Both have a derived pace of 6:00/km. These are constructed records, not sessions from a real athlete. The table shows the results of all four checks.
| Input arrangement | Entries kept | Distance reported |
|---|---|---|
| Same date, 5 km read first, equal fields | 1 | 5 km |
| Same date, 8 km read first, equal fields | 1 | 8 km |
| Same date, only the 8 km run has average heart rate | 1 | 8 km |
| Different dates, otherwise the original records | 2 | 13 km |
The score is two points for distance, two for duration and one for average heart rate. The first pair ties at four points each. Adding heart rate to the longer run raises its score to five. The chart replaces the previous record only when the new score is greater, so a tie depends on input order.
That is why calling the survivor the longest run would be wrong. It is the record with more of those fields, or the first among equals. The five-kilometre result misses eight of the 13 kilometres in the constructed day, about 62% after rounding. That percentage describes this example only, not a measured error rate among users.
The chart loses more than distance
After the collapse, the calculation sees one retained session. It treats the day as a single session and leaves out a best-pace figure. That rule is meant to avoid presenting the only observation as a meaningful personal best, but here the single-observation state was created by dropping the second run.
With the runs on different dates, the same chart retains both, totals 13 km and recognises two sessions. This isolates the date grouping as the cause. No permission change, new upload or different distance is involved.
The practical inference is that a doubles runner can look less active in this particular trend than in the underlying activity history. We have not measured how many roster members train twice in the same sport on one day. The worked cases establish the behavior, not its prevalence.
Why the guard exists, and where it stops helping
The intended tradeoff is that the chart it prefers undercounting a genuine two-a-day to giving duplicate credit. That tradeoff is explicit. It becomes especially costly when the result is presented as total distance, because selecting one record removes real volume along with a session count.
Duplicate records remain a real problem: one workout can arrive through several integrations. But sharing a sport and calendar date is not evidence that two records describe the same event. Distinct start times or source activity identifiers provide more information than a daily bucket alone.
A proposed repair would preserve distinct sessions after source matching, then aggregate their distances if a daily chart is desired. That is an implementation direction, not a shipped fix. It needs to keep true duplicates from returning while preserving genuine doubles and corrections.
Where to look before trying another sync
Start with the source device's activity list. Confirm that the two runs exist as separate recordings and check their dates and start times. Then inspect the receiving app's activity list rather than only its summary chart.
If both runs appear in that list but the chart shows one, report the two entries and the chart total together. Ask whether the chart sums daily sessions or selects a representative session. If only one reached the list, investigate import and matching first; the chart behavior demonstrated here cannot explain an absent source record.
Do not change a workout's real date to make a chart count it. The different-date example is a diagnostic control, not a workaround. Preserving the original recordings keeps the evidence needed to repair the total.
Kipp's current endurance chart still keeps one record per sport per date. The activity history should be checked before treating its chart total as a complete account of a day with two runs; this article documents the limitation without claiming a fix.